
01Four ledgers, kept apart on purpose
Ultraviolet is booked in hours, anywhere from 200 to 1500 h. Salt fog is also booked in hours, 24 to 480 h. Thermal cycling is booked as a count instead, 20 to 200 cycles, and humidity as a ceiling between 60 and 95 %. The units differ because the mechanisms differ, so a blended number cannot tell you which stress arrived first.
Pair every ledger with one observation. Ultraviolet shows up as chalking and colour shift on the outer skin. Thermal cycling shows up as gap growth at seams and latch seats. Humidity shows up as water uptake by weight. Salt fog shows up where pitting begins on hardware. Four readings taken separately are what make a strength-versus-energy comparison readable at all.
02The cycle count opens a seam before the temperature range does
Inside a −20 to 60 ℃ band, one cycle runs 2 to 6 h: ramp up, dwell, ramp down, dwell. Across the 20–200 range it is the count that does the work. Each pass expands the shell and the liner by different amounts, so the seam gets pushed and pulled, and the gap walks open a little further every time.
Stopping near the middle of that range carries more information than running to 200. Past that point most samples have reached the same failure shape and stop being distinguishable from each other. Around 100 cycles you can still see which one cracked first, and on which side. The log needs the number, not a sentence saying the cycling was passed.
03Humidity accelerates the chemistry and corrupts the measurement
Moisture speeds hydrolysis and drives plasticiser toward the surface, which is where tackiness and darkening come from. Within one profile, higher humidity means more damage for the same number of hours; 60 % and 95 % cannot be folded onto a single curve, and this is the easiest place to get the ranking wrong when two materials are close.
The interference shows up in weighing and dimension checks. Water adsorbed on the surface has to be read within 1 to 2 h of leaving the chamber, or uptake gets counted as material change. Before tensile testing, let the coupon sit near 23 ℃ so readings return to one baseline. Fix the conditioning time, or two datasets cannot be compared.
04Strength holds at 70–95 %, impact energy at 65–90 %
After all four ledgers, tensile strength usually retains 70 to 95 % and impact energy 65 to 90 %. The upper end is the informative part: with strength still above 90 %, energy can already sit near 70 %, because notched impact is far more sensitive to local defects along the polymer chain than a straight pull test is.
Reporting one figure — strength retained 85 % — is therefore incomplete. Notched coupons have to come from the same location, with matching orientation and wall thickness; otherwise the two lines are not comparable at all, and the comparison collapses into a test of specimen preparation. Move the sampling point and scatter in impact energy swamps the dose effect, leaving noise where a trend should sit.
05Two floors decide it, not an average
This grade passes on two floors: tensile strength retained at 70 % or better, impact energy at 65 % or better, both at once. If either drops below its floor, the other sitting near the top of its band does not rescue the run, because real loading finds the weaker line first and keeps working on it until the section gives.
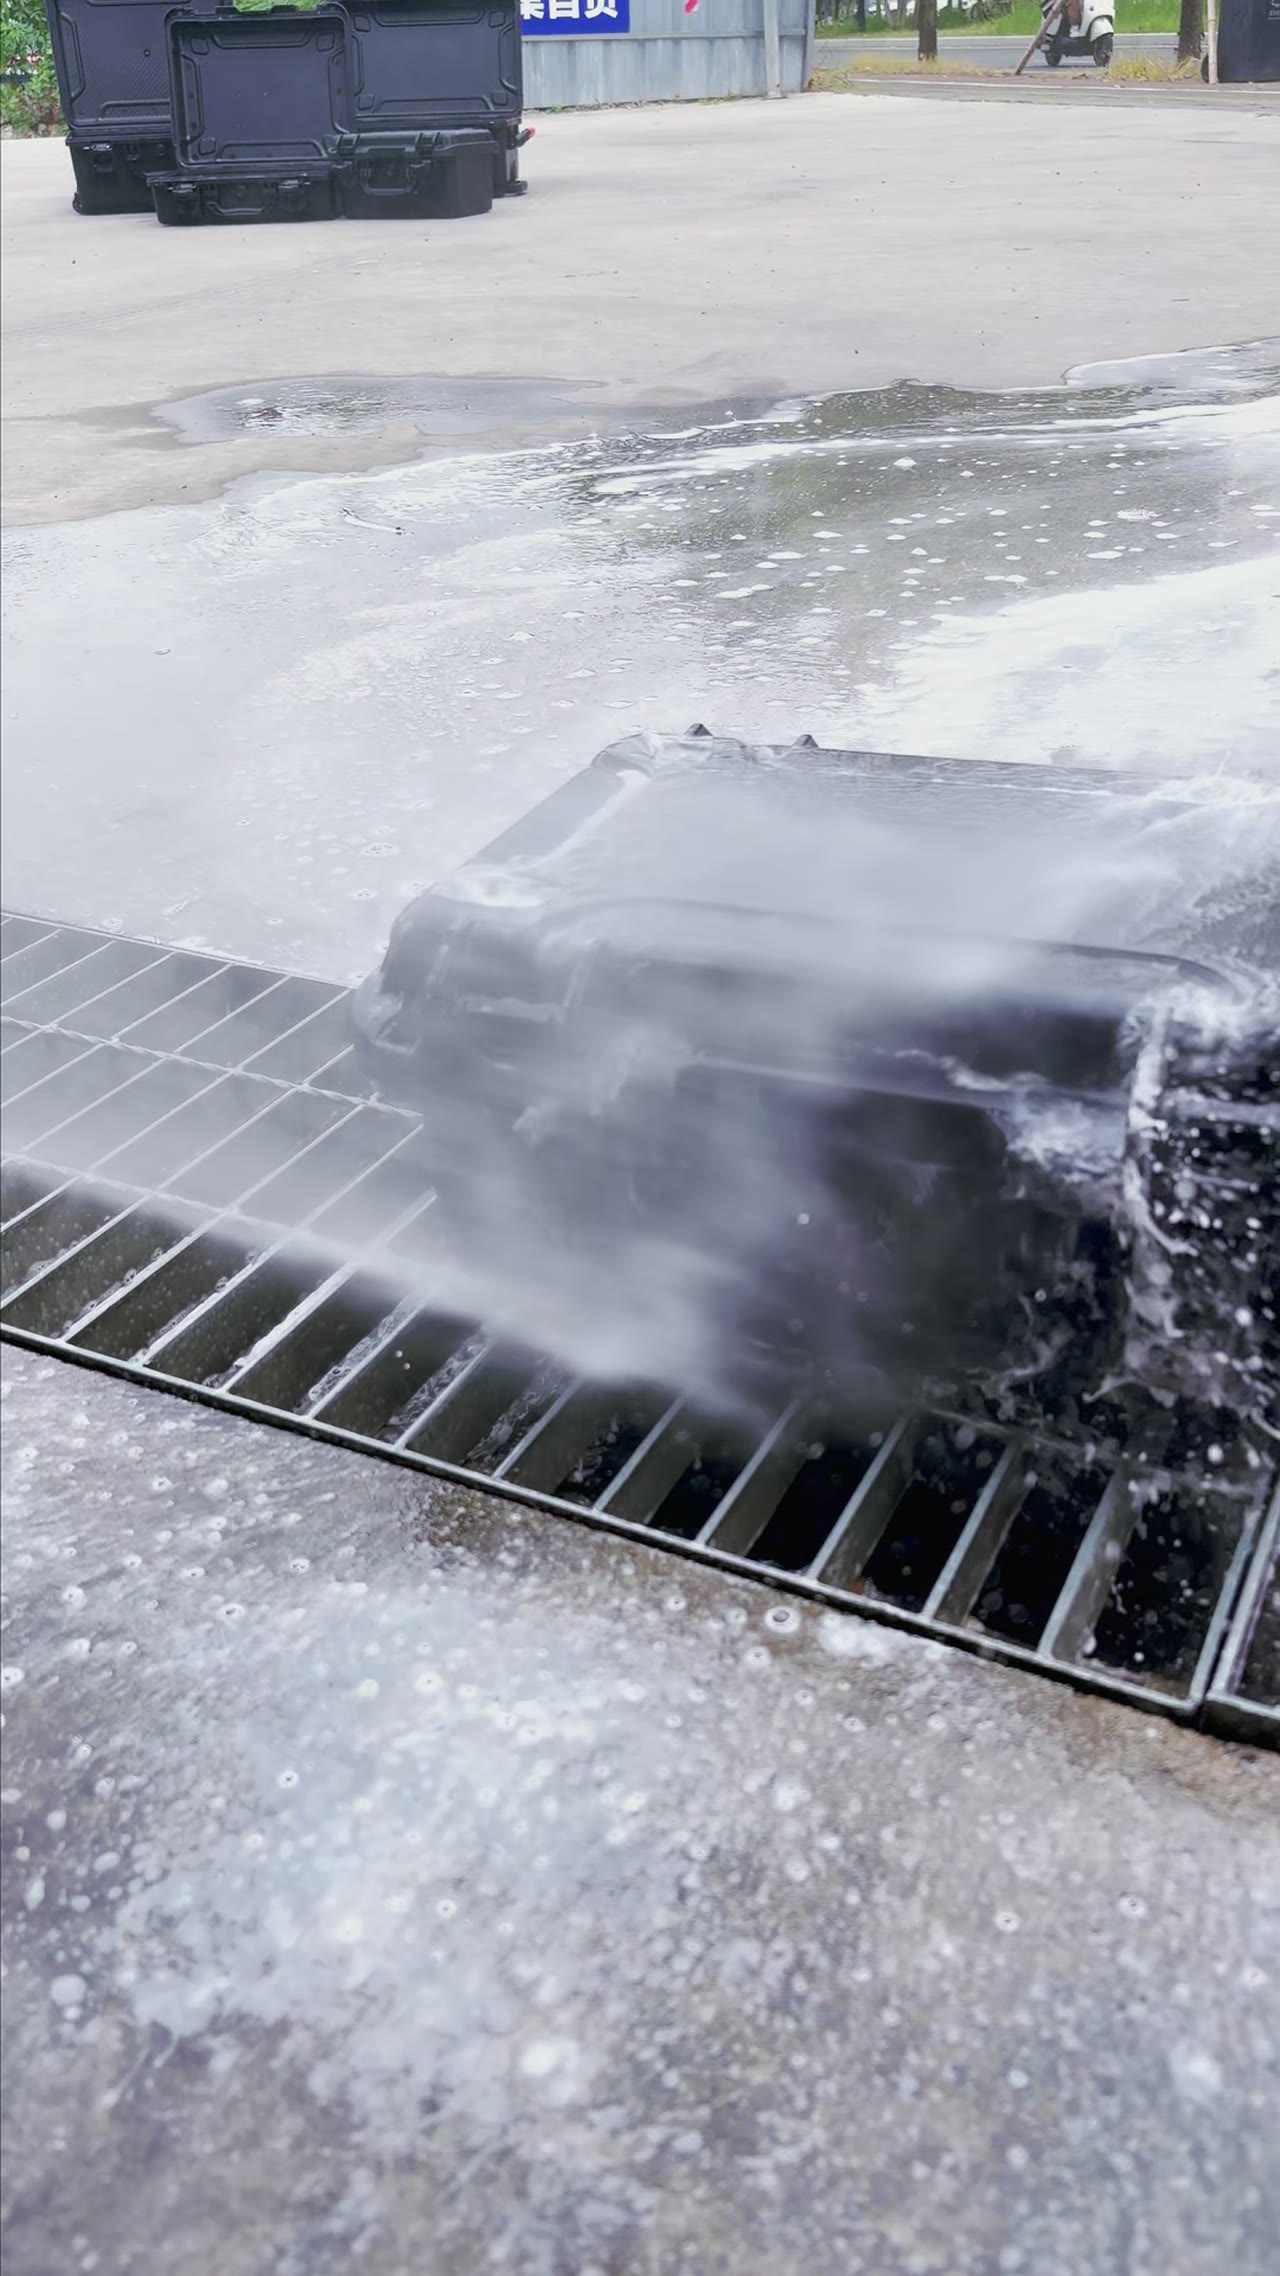
Recheck order is fixed. Look for pitting starts in the salt-fog group, then for colour shift on the UV face, then rerun the mechanical tests. Footage covers samples going in, coming out and being cut. Release depends on the formal record — dose log plus both retention figures. A video is not a protection rating. It documents handling, not margins.
| UV exposure duration | 200–1500 h cumulative |
|---|---|
| Thermal cycle range | −20 to 60 ℃ |
| Thermal cycle count | 20–200 cycles |
| Cycle humidity ceiling | 60–95 % |
| Salt fog exposure | 24–480 h continuous |
| Tensile strength retained | 70–95 % |
| Impact energy retained | 65–90 % |
| Single cycle duration | 2–6 h including ramps and dwells |
FAQ
Why not fold the four doses into one score?
Each stress attacks a different part at a different rate: UV works the skin, thermal cycling works the seam, salt fog works the hardware. Averaging them buries whichever one fails first, and then nothing can be traced.
Why stop near 100 cycles?
Past 200 most samples share one failure shape and stop telling each other apart. Twenty is too early to show a trend. Around 100 the order is still visible without every sample having walked the same path to the end.
Which falls first, strength or impact energy?
Impact energy, almost always. It depends on chain integrity and notch sensitivity, so a gap of 5 to 10 points opens at half dose while tensile strength is still near the top of its band.
The video only shows samples entering and leaving — how do you judge?
Both live in the formal record: hours per stage, cycle count, sampling location, retest values. Footage documents the process; the record carries the verdict.