


The short answer: vibration testing on a protective case answers two specific questions rather than the vague question of whether the box will shake apart. First, at which frequencies do the case and its contents resonate, and by how much is the response amplified? Second, under the accumulated vibration of a full transport journey, will latches, hinges, seals and liners suffer fatigue failure? The first question is answered by a sinusoidal sweep that searches for resonance. The second is answered by random vibration defined through a power spectral density curve, combined with Miner's linear damage accumulation rule to estimate endurance. The destructive power of transport vibration comes mainly from resonance: once the excitation frequency lands near a system natural frequency, the response can be amplified by an order of magnitude, turning an otherwise harmless low-level input into a sustained and damaging load.
Many buyers treat vibration testing as one item on an inspection checklist and assume it rarely matters. In reality the logistics chain damages protective cases in ways that are more insidious and more common than a single laboratory drop. A case that leaves the factory with an intact seal, tight latches and a snug liner may arrive at the customer with a relaxed latch, a shifted liner, and a rim that has warped just enough to fail an immersion test. Nothing dramatic happened along the way. What happened was hours of prolonged, apparently gentle vibration, and that is exactly what vibration testing exists to capture.
This article is written for procurement, structural design, packaging engineering and quality staff. It covers where transport vibration comes from and what its spectrum looks like, the trade-off between sinusoidal and random loading, how a resonance search is run and how to read a PSD, the amplification factor and how resonance cascades into functional failures, fatigue analysis through S-N curves and Miner's rule, how a test profile should be defined, how ISO 10846 relates to vibration isolation, the engineering options for controlling resonance, and how to write vibration requirements into a technical agreement so that they can actually be enforced. All frequencies, levels, durations and empirical coefficients quoted here are typical or empirical values; binding conditions must come from the current standards and the agreed test plan.
Contents
- What Vibration Testing Actually Measures
- Where Transport Vibration Comes From and What Its Spectrum Looks Like
- The Standard Family: ASTM D4169, ISTA and the National Series
- Sinusoidal and Random Vibration: Choosing the Right Loading
- Resonance Search: How a Sinusoidal Sweep Is Run
- Random Vibration and PSD: How to Read a Power Spectral Density Curve
- Resonance Amplification and the Q Factor
- How Resonance Cascades into Functional Failures
- Fatigue Analysis: S-N Curves and Miner's Rule
- Defining the Test Profile: Level, Duration, Axes and Fixture
- ISO 10846 and Vibration Isolation: Frequency Ratio and Cushioning
- Engineering Options for Controlling Resonance
- Writing Vibration Requirements into a Technical Agreement
- Frequently Asked Questions
- Conclusion and Related Reading
What Vibration Testing Actually Measures
Define the target first. Vibration acts on a protective case along two entirely different failure paths.
The first path is resonance amplification. Every elastic system has natural frequencies. When the excitation frequency approaches one of them, the response is amplified, and the amplification factor depends on the damping ratio. A case that is completely safe under static load may experience several times, or even tens of times, that load dynamically at its natural frequency. The first task of vibration testing is therefore to find those natural frequencies, which is what a resonance search does.
The second path is fatigue accumulation. Even when stress stays below the yield strength of the material, repeated application accumulates damage. During transport a case experiences continuous vibration for hours to tens of hours, across a frequency range from a few hertz to several hundred hertz, with load cycles running into the millions. At that scale, even a very small stress per cycle can accumulate enough damage to relax a latch, fret a hinge pin, cause permanent set in a gasket, or initiate a crack at the root of a reinforcing rib.
The output of a vibration test should therefore contain three kinds of information:
- Resonant frequencies and amplification factors. Which frequencies are dangerous, and how dangerous.
- Structural integrity and functional retention. After the test, no cracks, no latch release, no movement of contents, no loss of sealing.
- Fatigue endurance. How long the case survives under a given profile before functional degradation appears.
A test that only looks for visible damage after shaking has limited value. A test that reports resonant frequencies and amplification factors can guide design improvement.
The value of vibration testing in one line: it turns invisible transport damage into data that can be measured, reproduced and acted upon in the laboratory.
Where Transport Vibration Comes From and What Its Spectrum Looks Like
Different transport modes produce very different vibration characteristics, which is why a test profile must correspond to the actual logistics route rather than being applied generically.
Road transport. The dominant source and the basis for most packaging test spectra. The characteristics come from the coupling of road roughness with the vehicle suspension: the very low frequency band reflects rigid-body motion of the body and suspension, the mid band reflects the suspension and wheel systems, and the high band reflects body panels, cargo-to-cargo impacts and road surface detail. Levels vary widely with road condition, speed, load and tyre pressure. A good motorway is markedly gentle; gravel and broken surfaces raise the level substantially.
Rail transport. Vibration is more periodic, with spectra often concentrated at discrete frequencies such as wheel rotation frequency and its harmonics, accompanied by longitudinal impacts during marshalling. The impact component is what distinguishes rail transport from road.
Sea transport. Overall levels are usually lower than road, but the duration is extremely long, lasting weeks, and low-frequency roll and wave slam are superimposed. In addition, the humidity and salt spray of a sea voyage act in combination with vibration, accelerating wear and corrosion of metal parts.
Air transport. Cruise vibration is relatively high in frequency but low in amplitude. The principal risks are take-off and landing shocks and pressure changes. For a protective case, air transport tests low pressure and temperature more than it tests prolonged vibration.
A real multi-modal profile is a spliced spectrum. This is the part most often simplified away when a test plan is written: suppliers frequently apply a generic random vibration profile without distinguishing the target logistics route. The correct approach is to build a composite profile from the segments of the actual route, weighted by their share of the total time.
| Transport mode | Typical frequency range | Level characteristics | Duration characteristics | Additional stresses |
|---|---|---|---|---|
| --- | --- | --- | --- | --- |
| Road | A few Hz to several hundred Hz | Varies widely with road and speed | Hours to tens of hours | Temperature, humidity, stacking |
| Rail | Mostly discrete frequencies | Strongly periodic | Tens of hours | Marshalling longitudinal impacts |
| Sea | Low frequency dominant, with high frequency superimposed | Lower levels | Weeks | Humidity, salt spray, roll |
| Air | Mid to high frequency | Lower amplitude | Hours | Low pressure, temperature |
| Last-mile delivery | Similar to road, more impacts | Highly variable | Tens of minutes to hours | Repeated handling drops |
The Standard Family: ASTM D4169, ISTA and the National Series
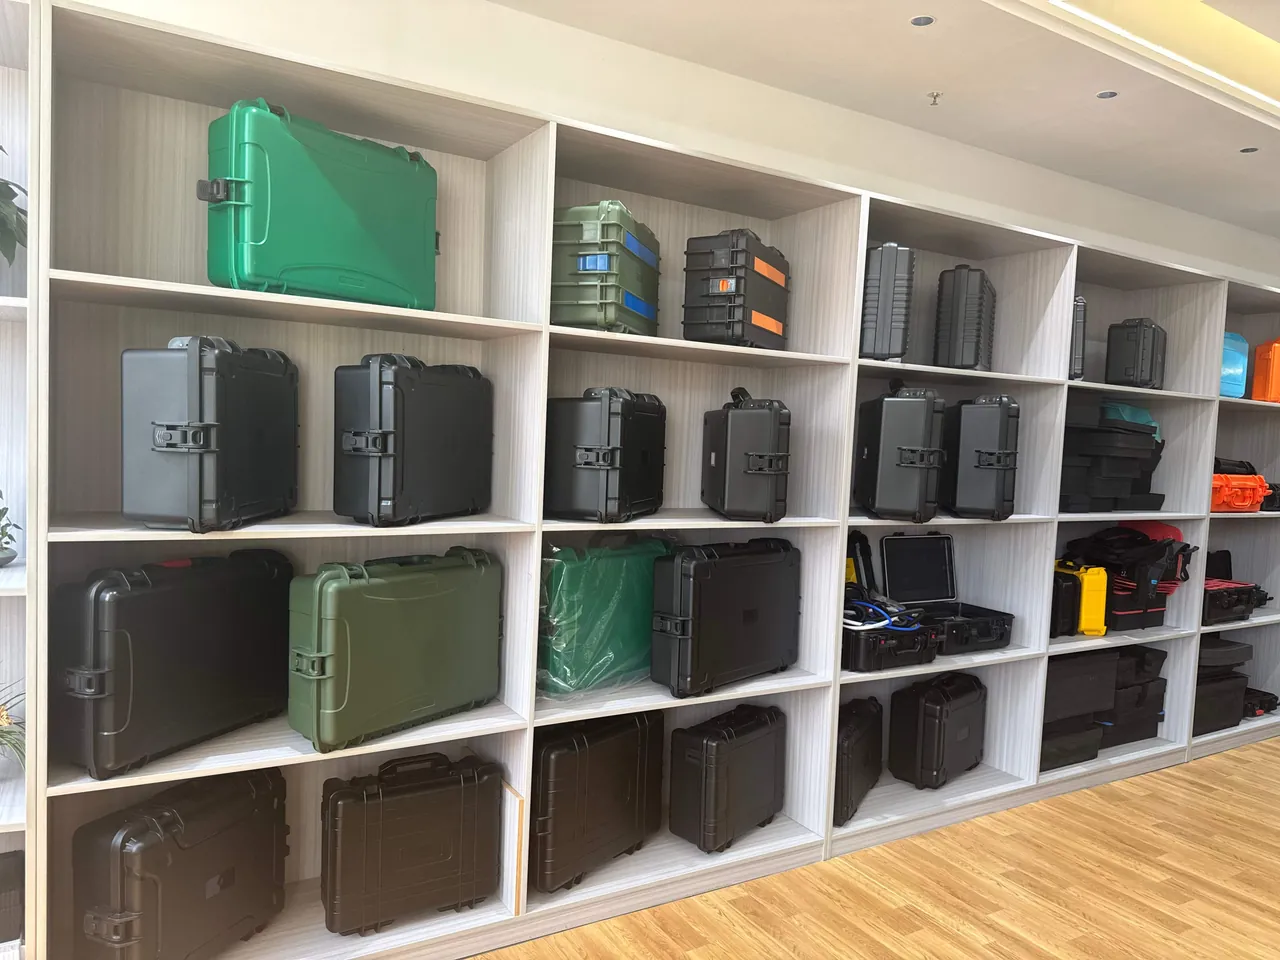
Understanding how the standards divide the work is a precondition for judging whether a vibration report matches the intended scenario. The commonly used documents fall into four groups.
| Standard | Title and scope | Category | Typical positioning |
|---|---|---|---|
| --- | --- | --- | --- |
| ASTM D4169 | Performance testing of shipping containers and systems | Combined transport testing | The most common complete transport profile in North America |
| ASTM D4728 | Random vibration testing of shipping containers | Random vibration | Method basis for random vibration alone |
| ASTM D999 | Vibration testing of shipping containers | Sinusoidal and random | Offers several vibration test method options |
| ASTM D3580 | Vibration testing of products, sinusoidal | Product level | Product resonance and endurance assessment |
| ISTA series | International Safe Transit Association test procedures | Combined transport testing | Widely used in e-commerce and retail supply chains |
| GB/T 4857 series | Basic tests for transport packages | Combined and individual | The domestic transport packaging basis in China |
| ISO 4180 | Complete filled transport packages, test schedules | Combined transport testing | Internationally used test schedules |
| ISO 13355 | Complete filled transport packages, vertical random vibration | Random vibration | International random vibration method |
| IEC 60068-2-6 | Sinusoidal vibration test | Product level | Sinusoidal vibration for electrotechnical products |
| IEC 60068-2-64 | Broadband random vibration test | Product level | Random vibration for electrotechnical products |
| ISO 10846 | Measurement of vibro-acoustic transfer properties of resilient elements | Component level | Performance evaluation of isolation elements |
| MIL-STD-810 Method 514 | Vibration | Environmental testing | Vibration environment adaptation for military equipment |
Three levels of standard need to be distinguished clearly:
- Packaging level (ASTM D4169, ISTA, the national transport package series, ISO 4180, ISO 13355): the whole packed case is treated as the transport unit, and what is assessed is whether the package survives logistics. This is the level most often used for protective cases.
- Product level (IEC 60068-2-6, IEC 60068-2-64, ASTM D3580): the product itself is the subject, and what is assessed is whether it maintains function under vibration. This applies when the case ships as a product in its own right.
- Component level (ISO 10846): the performance parameters of isolation elements such as rubber buffers and dampers. This applies when vibration isolation is designed into the case interior.
In domestic projects the three vibration parts of the national transport package series are most frequently used: fixed-frequency sinusoidal vibration, swept sinusoidal vibration and random vibration, corresponding to different purposes. A clause that says "vibration testing per the national transport package series" is incomplete, because it must state which part, at what level, and for how long.
Sinusoidal and Random Vibration: Choosing the Right Loading
The two loading families serve quite different purposes.
Sinusoidal vibration. A single frequency with controlled amplitude. It divides into fixed frequency and swept frequency. Fixed frequency is used to sustain a known resonant frequency; swept frequency is used to search for an unknown one. Its core advantage is that the energy is concentrated and the result is interpretable: you know exactly what frequency and acceleration are being applied, so response and excitation correspond one to one. Its drawback is that real transport is not single-frequency, so sinusoidal vibration does not represent the actual load.
Random vibration. All frequencies are present simultaneously and the energy follows a statistical distribution. It is described by a power spectral density curve and characterised overall by the root-mean-square acceleration. Its advantage is that it is much closer to the real transport environment, since road excitation is inherently broadband and random. Its drawback is weaker interpretability: determining how a change at one point in the spectrum affects failure requires further analysis.
The selection principles are as follows.
- For a resonance search, use a sinusoidal sweep. Only a sweep produces a clear frequency response curve from which resonant points and amplification factors can be derived.
- For transport endurance, use random vibration. It is closer to real logistics and covers the frequency range more thoroughly within the same time.
- For failure localisation and fault reproduction, use fixed-frequency sinusoidal. Dwelling at a known resonant frequency reproduces and magnifies a specific failure mode quickly.
- For customer certification, use the customer's specified standard. Where a customer standard or industry code mandates a method, that method governs.
In practice, the most efficient arrangement is to sweep first to find resonance, then design the random profile around it: use the sinusoidal sweep to identify natural frequencies and dangerous bands, then confirm in the random profile whether those bands are covered and whether the energy there is sufficient. This is the approach recommended across ASTM D999 and the IEC 60068 series.
| Loading | Description | Strengths | Limitations | Typical use |
|---|---|---|---|---|
| --- | --- | --- | --- | --- |
| Fixed-frequency sinusoidal | Single frequency, fixed amplitude | Concentrated energy, reproducible | Not representative of real environment | Resonant-frequency endurance, fault reproduction |
| Swept sinusoidal | Continuously varying frequency | Produces a frequency response curve | Longer test time | Resonance search, modal identification |
| Random vibration | Broadband, described by PSD | Closest to real transport | Weaker interpretability | Transport endurance and fatigue assessment |
| Shock response spectrum | Transient pulse | Characterises shock severity | Does not reflect sustained vibration | Drop and marshalling impact evaluation |
Resonance Search: How a Sinusoidal Sweep Is Run
The resonance search is the first step of vibration testing and the one most often skipped. It breaks into six stages.
- Set the sweep range. Base it on the frequency distribution of transport vibration and on the structural characteristics of the case. Empirically, packaging sweeps commonly run from a few hertz to several hundred hertz, covering body rigid modes, suspension modes and case structural modes. Too narrow a range may miss a critical resonance; too wide wastes time.
- Choose the sweep rate. The usual unit is octaves per minute, meaning how long it takes for the frequency to double. A slower rate captures narrow resonances more completely but extends the test. If the sweep is too fast, the system does not reach steady-state response as it passes through resonance, and the measured amplification is understated, which is a common source of measurement error.
- Choose the excitation level. The level must be high enough to excite a response yet low enough to avoid damage. The usual approach is two-stage: a low-level exploratory sweep to locate resonances, then a higher-level dwell at those resonances for endurance.
- Place the accelerometers. Mount sensors on both the external surface of the case and on the contents or simulated payload. Monitoring only the case will miss the resonance of the contents, and the contents are frequently the part that shifts and breaks.
- Plot the frequency response curve. Frequency on the horizontal axis, transmissibility or acceleration response on the vertical. Peaks in the curve mark the resonant frequencies.
- Quantify the amplification. At a resonant frequency, the ratio of response acceleration to input acceleration is the amplification factor of that mode. That number determines whether the resonance is dangerous and whether a design change is needed.
An engineering note: the important question in a resonance search is not whether resonance exists, which it almost always does, but which frequency band it occupies, how much it amplifies, and how much energy real transport carries in that band. A band that amplifies ten times but carries very little energy in the real spectrum may be harmless, while a band that amplifies only three times but sits on a peak in the real spectrum may be fatal.
Random Vibration and PSD: How to Read a Power Spectral Density Curve
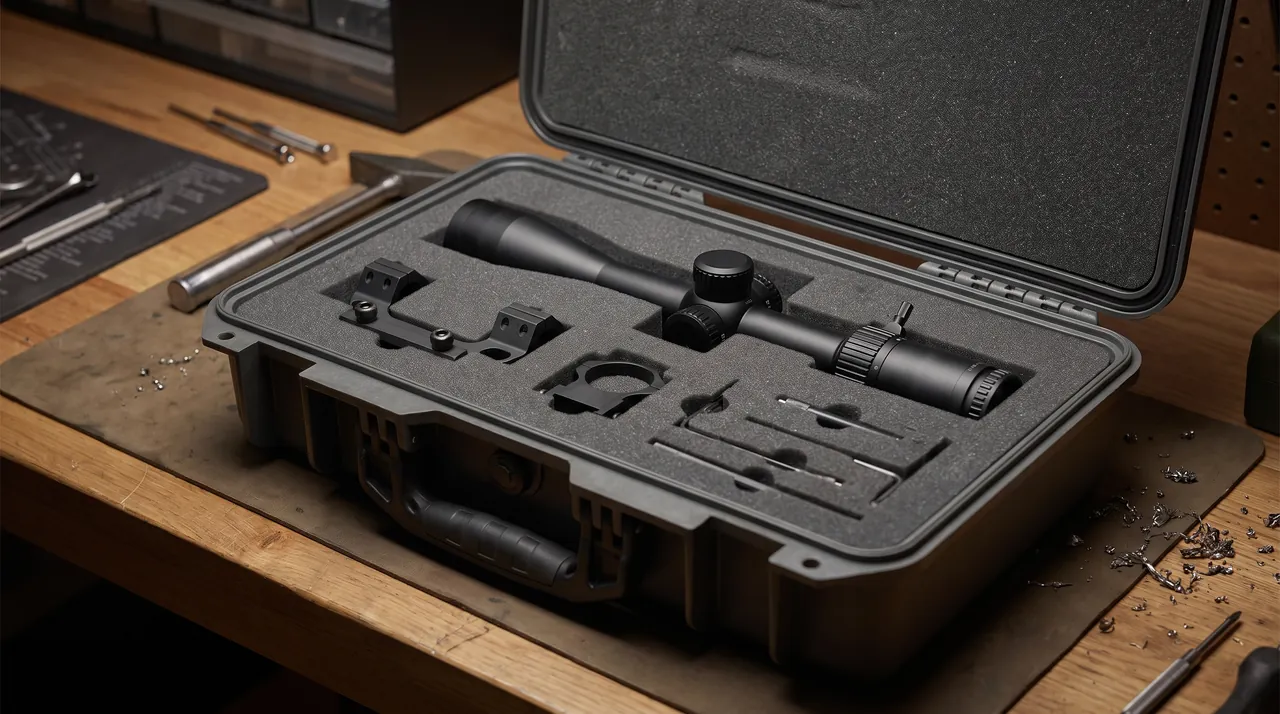
A random vibration profile is expressed as a power spectral density curve. Reading a PSD requires five elements.
First, the horizontal axis is frequency and the vertical axis is spectral density. The usual unit is acceleration squared per hertz. It is not "the acceleration at a particular frequency" but an energy density concept describing how much vibration energy falls within a unit frequency band.
Second, the curve is made of straight segments. A typical transport PSD consists of several segments: a flat segment means the energy is distributed uniformly across that band, while a rising or falling segment means the energy varies with frequency, which appears as a slope on log-log axes. The end points of each segment are called breakpoints, and the frequency and density at each breakpoint together define the curve.
Third, the overall root-mean-square acceleration equals the square root of the area under the curve. This is the most intuitive overall severity measure and the usual way to test which of two profiles is harsher. Calculate it by integrating the area under the PSD across the frequency bands and taking the square root. Note that equal RMS values do not mean identical profiles: a narrowband profile with concentrated energy and a broadband profile with dispersed energy can produce the same RMS while causing completely different failures.
Fourth, the product of spectral density and duration determines cumulative damage. This is the core of fatigue analysis: with the same spectrum, doubling the exposure time roughly doubles the damage under a linear accumulation assumption.
Fifth, axes and duration must correspond to the transport. All three orthogonal axes are normally tested, or the severest axis is selected per the standard. Test duration may be compressed, for example turning several hours of transport into a few minutes of laboratory testing, but the compression method and acceleration factor must follow the standard and the basis must be stated.
| PSD element | Meaning | Common expression | Point to check |
|---|---|---|---|
| --- | --- | --- | --- |
| Frequency range | Band covered | A few Hz to several hundred Hz | Whether known resonances are covered |
| Spectral density | Energy per unit band | Acceleration squared per hertz | Whether the level matches the real route |
| Segment slope | How energy varies with frequency | Log-log slope | Whether peaks fall in resonant bands |
| RMS acceleration | Overall root-mean-square | A single number | Equal RMS does not mean equal severity |
| Duration | Exposure per axis | Minutes or hours | Whether a compression basis is stated |
Resonance Amplification and the Q Factor
Resonance amplification is the central concept of vibration analysis. For a single-degree-of-freedom system, transmissibility can be approximated as:
T = 1 / sqrt( (1 minus r squared) squared + (2 zeta r) squared )
Here r is the ratio of excitation frequency to natural frequency and zeta is the damping ratio. As r approaches one, meaning the excitation frequency approaches the natural frequency, transmissibility approaches 1 divided by 2 zeta, which is the amplification factor Q at resonance. Several consequences follow.
- The lower the damping ratio, the more violent the amplification. A damping ratio of 0.05, typical of metal structures, amplifies about ten times. A ratio of 0.01 amplifies about fifty times. A ratio of 0.2, typical of high-damping rubber, amplifies about two and a half times. This explains why adding damping is one of the most effective ways to control resonance.
- The resonant band is narrow but the damage is concentrated. Amplification changes sharply around the natural frequency and falls away quickly once you move off it. Being able to avoid or suppress that narrow band therefore relieves most of the problem.
- A multi-degree-of-freedom system has several resonant peaks. A real case is a continuous structure with a series of modes. Low-order modes correspond to overall bending and torsion, while high-order modes correspond to local panel vibration. The former are more damaging because they move the whole case and excite the contents.
- Secondary resonance of the contents adds on top. The contents are coupled to the case through the liner. If the natural frequency of the contents is close to a case mode, the two couple and amplify together, producing the most dangerous condition. This is the classic explanation for a case that survives while its contents do not.
| Damping ratio | Amplification factor Q, approximate | Typical structure or material | Countermeasure |
|---|---|---|---|
| --- | --- | --- | --- |
| 0.01 | About 50 | Low-damping metal structures, undamped thin panels | Must add damping or shift frequency |
| 0.05 | About 10 | General engineering plastics and metal assemblies | Common design target range |
| 0.10 | About 5 | Composite parts with damping features | Acceptable, verify the load |
| 0.20 | About 2.5 | High-damping rubber, foam-filled assemblies | Gentle amplification, watch heat and weight |
How Resonance Cascades into Functional Failures
Resonance does not break structures directly. It causes failures through a series of cascading paths. In protective cases there are five common ones.
First, latch release. The latch is the part most susceptible to vibration. Sustained vibration gradually erodes clamping force, particularly when the vibration frequency approaches the natural frequency of the latch arm, at which point the catch begins to chatter and holding force falls. The immediate consequence of release is insufficient rim compression and loss of sealing. Structure and life verification for these parts is covered in how to choose case latches and latch cycle life testing.
Second, liner and contents displacement. The liner exists to hold the contents in place. If the liner material lacks damping or its compression ratio is wrong, vibration lets the contents creep within the cavity and eventually strike the wall. The displacement itself may not be fatal, but it causes contents to rub against each other, loosens connectors, and shifts the centre of gravity, which leads to a secondary impact.
Third, compression set in the gasket. Under prolonged vibration, a rubber gasket suffers micro-slip and heat build-up that accelerate compression set. The deformed gasket can no longer recover its original section, and rim sealing force falls. This path is particularly insidious: the case looks perfectly normal after the test, yet airtightness already fails. The verification method is covered in pressure decay airtight testing.
Fourth, crack initiation at rib roots and fillets. Stress concentrations initiate micro-cracks under alternating load, which then propagate. Cracks typically appear at reinforcing rib roots, around inserts, and at wall thickness transitions, which are both stress concentration points and common manufacturing defect sites. Relevant design guidance is in how to design case reinforcing ribs and how to design a high-strength case structure.
Fifth, fretting wear of metal parts and loosening of inserts. Hinge pins, screws and metal inserts move microscopically relative to each other under vibration, causing wear, coating damage and loss of preload. In damp or salt-laden environments, wear and corrosion accelerate each other.
| Failure path | Immediate cause | Visible symptom after test | Verification method |
|---|---|---|---|
| --- | --- | --- | --- |
| Latch release | Catch chatter, falling holding force | Reduced clamping force, loose lid | Clamp force measurement, cycle life test |
| Liner displacement | Insufficient damping, wrong compression | Shifted contents, rub marks | Strip-down with position marking |
| Gasket compression set | Micro-slip and heat | Normal appearance but failed airtightness | Airtight test, compression set test |
| Rib root cracking | Stress concentration, alternating load | Fine cracks, whitening | Visual and dye penetrant inspection |
| Metal part loosening | Fretting wear | Reduced preload, corrosion | Torque recheck, strip-down |
Fatigue Analysis: S-N Curves and Miner's Rule
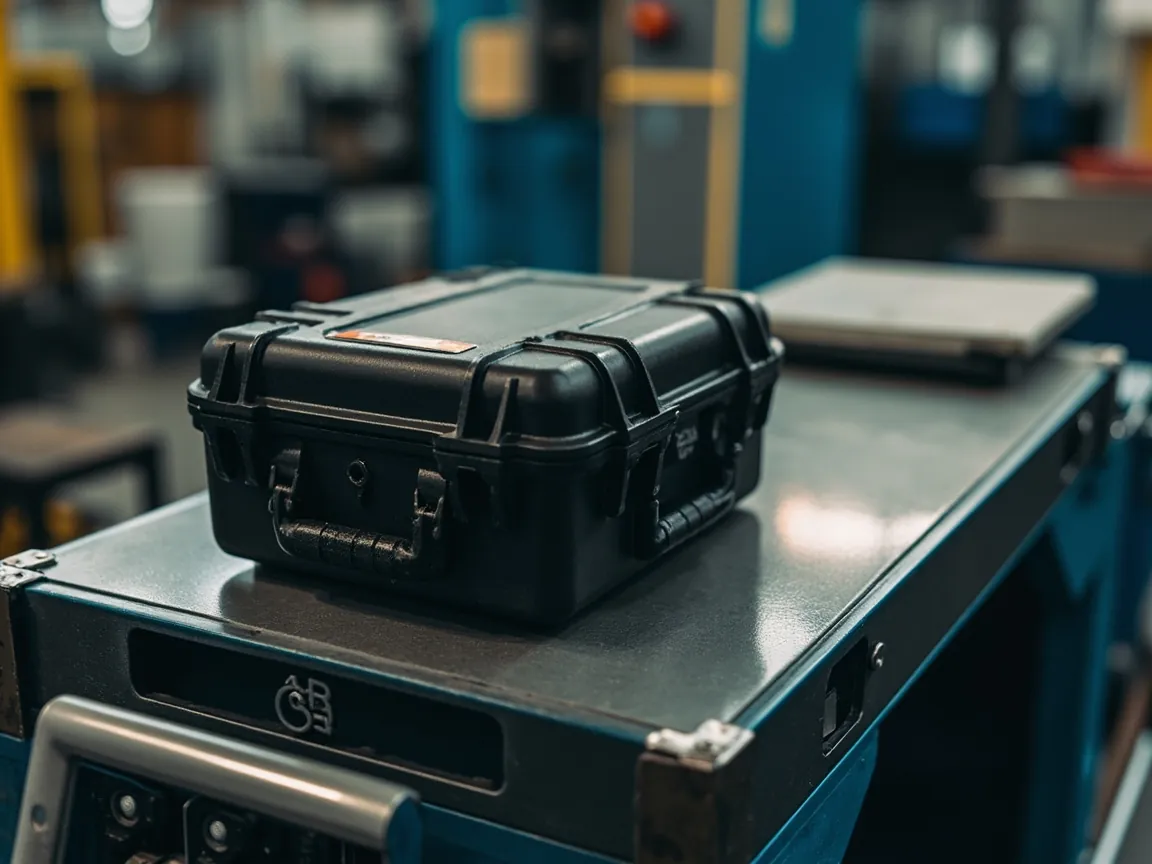
The endurance part of vibration testing is fundamentally a fatigue problem. Two tools are used for quantitative assessment.
The S-N curve, also called the fatigue life curve. Stress amplitude S is plotted against the number of cycles to failure N, usually on log-log axes, describing how many cycles a material survives at each stress level. Two features are typical. First, life lengthens markedly as stress falls. Second, below a certain stress level the curve tends to flatten, and that value is the fatigue limit. For polymers the fatigue limit is often indistinct, meaning there is no absolutely safe stress level, only a range in which damage accumulates slowly.
Miner's linear damage accumulation rule. When the load contains several levels, the damage from each segment is computed as the actual number of cycles divided by the cycles to failure at that stress, and the results are summed:
D = sum of ( n i divided by N i )
Failure is theoretically reached when the accumulated damage D equals one. The value of the rule is that it breaks a complex random load into manageable segments and provides a single damage scale. In engineering practice a threshold below one is often used to provide a safety margin.
Random vibration damage has one important characteristic: damage is contributed mainly by the energy near the resonant peaks. Damage scales with a high power of stress amplitude, with exponents typically in the range of three to ten depending on material and structure, and stress amplitude is amplified by the PSD value at resonance. A small change in the PSD at the resonant frequency therefore produces a large change in damage. Two practical conclusions follow:
- Profile optimisation should focus on energy in the resonant band rather than the overall level. Reducing RMS by ten percent while leaving the resonant peak untouched yields only marginal improvement.
- Design improvement should reduce amplification at resonance rather than thickening everything. Adding damping or shifting natural frequency by changing stiffness is usually more effective and lighter.
A note for buyers: a vibration report stating only "no visible abnormality after testing" tells you that this particular run did not break the case. Only a report containing resonant frequencies, amplification factors and pre- and post-test functional measurements lets you judge the margin the case has in real logistics.
Defining the Test Profile: Level, Duration, Axes and Fixture
Profile design is the part of vibration testing that most requires engineering judgement. It breaks into five elements.
Level. Determined by the target logistics route, not by industry habit. Identify the transport modes and road conditions of the target market and select the corresponding standard spectrum or measured spectrum. Where the customer supplies measured data, use the measured spectrum in preference. Where none exists, use the standard spectrum matching that route. Do not apply the harshest available spectrum indiscriminately to every product, because that leads to over-design and wasted cost.
Duration. Derived from actual transport time, a standard equivalent time, or a compressed accelerated time. The basis for compression must be stated. The common approach is to compress several hours of transport into a few minutes of laboratory testing according to the standard's acceleration relationship, and to state the compression ratio and its basis in the report.
Axes. Three orthogonal axes are normally required. The vertical axis usually carries the highest level and the greatest risk, because road excitation and stacking loads both act vertically. The longitudinal horizontal axis corresponds to vehicle acceleration and braking, and the lateral horizontal axis to cornering and roll. Whether all three are tested and for how long should be stated explicitly in the test plan.
Fixture and mounting. Fixture design directly determines test validity. The fixture must be rigid enough that its own natural frequency is well above the test upper limit, must reproduce the actual packaging state including pallet and stacking load, and must not introduce additional constraint through the clamping method. Fixture resonance is one of the most common reasons a test is invalid, so sweeping the empty fixture first to confirm its resonance sits above the test upper limit is recommended.
Monitoring and abort criteria. Response should be monitored in real time with pre-defined abort criteria, such as response exceeding a threshold, abnormal noise, or a latch releasing. After the test, the predefined items should be rechecked: latch clamp force, sealing performance, contents position, structure and appearance. A vibration report without before-and-after comparison data is of limited persuasive value.
| Profile element | Basis for decision | Common treatment | Frequent mistake |
|---|---|---|---|
| --- | --- | --- | --- |
| Level | Target route and measured data | Select the matching standard spectrum | Applying the harshest spectrum indiscriminately |
| Duration | Actual transport time and compression | Compress per standard, state the basis | Unclear compression basis |
| Axes | Excitation direction and structural sensitivity | Three axes or per standard | Testing the vertical axis only |
| Fixture | Rigidity and packaging state | Sweep the empty fixture first | Fixture resonance contaminating results |
| Criteria and recheck | Functional retention requirements | Before-and-after comparative testing | Appearance inspection only |
ISO 10846 and Vibration Isolation: Frequency Ratio and Cushioning
When a protective case carries precision or sensitive equipment, the case structure alone may not reduce vibration to an acceptable level, and an isolation or cushioning stage is needed between the case and the contents. The ISO 10846 series provides methods for measuring the vibro-acoustic transfer properties of resilient elements, used to evaluate the dynamic stiffness and damping of isolation elements such as rubber pads, dampers and foam.
The central concept in isolation design is the frequency ratio:
r = f divided by f n
Here f is the excitation frequency and f n is the natural frequency of the isolation system. The conclusions are unambiguous:
- When r is below about 1.414, the isolation system amplifies vibration rather than reducing it. This is the root of many design failures: choosing an isolation pad that is too soft places the system natural frequency inside the main excitation energy band, so vibration is amplified instead of attenuated.
- Above about 1.414 isolation begins, and the larger r becomes the better the isolation. But a very large r implies a very low natural frequency and therefore a very soft element, which degrades static stability and increases the risk of large displacements and collisions.
- The usual engineering compromise is an r between about 2.5 and 5. In that range meaningful isolation is obtained while static stability is preserved.
Three direct applications follow for protective cases:
- Liner material should not be chosen purely for softness. The effective stiffness of the liner sets the natural frequency of the contents-and-liner system. If that frequency falls inside the main transport energy band, the contents are amplified rather than protected.
- Cushioning and isolation are different objectives. Cushioning addresses short-duration shock such as a drop and seeks to absorb energy. Isolation addresses sustained vibration and seeks to lower transmissibility. Satisfying both with a single material requires careful trade-off, and "softer is better" is not a valid rule.
- Stacking changes the system frequency. Stacking adds effective mass and constraint that can shift the natural frequency, so if the case is stacked during transport the test should include the stacked condition. Related verification is covered in how stacking load testing works.
Engineering Options for Controlling Resonance
Once resonance is identified, there are four engineering routes, listed here in order of return on investment.
First, shift the natural frequency. Adjust stiffness and mass so the natural frequency moves out of the band where excitation energy concentrates. Options include adjusting wall thickness and rib layout, changing the case aspect ratio, adding or removing mass, and changing the liner support arrangement. This is the most fundamental and often the least costly route, because it avoids the resonance at source.
Second, add damping. Convert vibration energy into heat through high-damping materials, directly reducing the amplification factor. Options include high-damping rubber or foam, a damping layer bonded to large thin panels, and damping pads at assembly interfaces. Damping is particularly effective for high-order and local modes and usually adds little weight.
Third, isolate. Insert resilient elements between the case and the contents, or between the case and the transport platform, to lower transmissibility. The governing principle is the frequency ratio described above.
Fourth, increase structural strength. When the first three routes are insufficient, the only remaining option is thicker walls, more ribs and larger fillets. This is the most expensive and heaviest route and should be the last resort. It also does not address the amplification itself; it merely allows the structure to survive the amplified load.
| Route | Mechanism | Main methods | Advantage | Cost |
|---|---|---|---|---|
| --- | --- | --- | --- | --- |
| Shift frequency | Move natural frequency | Adjust stiffness, mass, layout | Fundamental, low cost | Requires simulation and verification |
| Add damping | Dissipate energy, lower amplification | Damping materials, bonded layers | Effective at high frequency, low weight gain | Material cost and process complexity |
| Isolate | Lower transmissibility | Resilient elements, frequency ratio design | Directly protects contents | Static stability and displacement risk |
| Increase strength | Raise load capacity | Thicker walls, ribs, fillets | Broadly applicable | Higher weight and cost |
One point must be emphasised: improvement should proceed through a closed loop of test, analyse, retest. Simulation can predict modes, but assembly tolerances, material batch variation and the actual compression state of the liner all shift the real natural frequency, so a sweep must be repeated after any change. Where the customer supplies the complete assembly, coupling between the equipment and the case must also be considered.
Writing Vibration Requirements into a Technical Agreement
A vibration clause that says only "shall pass vibration testing" is essentially unenforceable. Seven items belong in the agreement.
- Standard and method. State the standard number and edition, and whether a sinusoidal sweep, a fixed-frequency dwell or random vibration applies.
- The complete test profile. For random vibration, give the PSD breakpoints and slopes, the overall RMS acceleration, and the duration per axis. For sinusoidal vibration, give the frequency range, sweep rate, acceleration amplitude and number of cycles.
- Axes and test sequence. State which axes are tested, in what order, and whether a temperature and humidity pre-conditioning step precedes vibration, since ageing before vibration exposes more problems.
- Sample state. Empty case, with liner, with simulated payload, or loaded with actual contents; whether a pallet is included and whether the unit is stacked. Different states are not comparable.
- Pre- and post-test rechecks with acceptance thresholds. At minimum, appearance and structure, latch clamp force, sealing performance such as airtightness or immersion, contents displacement, and any required functional tests.
- Failure criteria and abort rules. State what counts as a failure and what may be paused and adjusted.
- Change and retest rules. State whether a change of structure, material, latch model or liner design requires revalidation.
| Agreement element | Risk if omitted | Recommended wording |
|---|---|---|
| --- | --- | --- |
| Standard and method | Reports cannot be cross-accepted | Cite standard number, edition and method |
| Profile parameters | Severity cannot be judged | List PSD breakpoints, RMS and duration or sweep parameters |
| Axes and sequence | Coverage incomplete | State the three axes and their order |
| Sample state | Results cannot be extrapolated | Describe liner, payload and stacking |
| Recheck items | Hidden failures are missed | List functional rechecks and thresholds |
| Change rules | Uncontrolled risk after a material swap | Define retest triggers |
The most common hidden failure is a case that looks intact but no longer seals. It is therefore strongly recommended to run an airtightness check before and after the vibration test as a fixed recheck item. The overall design and validation logic for an IP67 case is covered in how an IP67 protective case is engineered, and the test method in how pressure decay airtight testing works.
Frequently Asked Questions
Q: What problems can vibration testing actually find in a protective case? A: It finds two classes of problem, one related to resonance and one to fatigue. Resonance problems appear as a marked amplification of the case or contents response at a particular frequency, potentially several times or even tens of times the input. These are invisible during static inspection and only emerge during a sweep. Fatigue problems appear after prolonged vibration as reduced latch clamp force, shifted liner and contents, compression set in the gasket, micro-cracks at rib roots, and loss of preload in metal inserts. The most deceptive of these is seal failure: after the test the appearance, colour and structure look normal, yet airtightness already fails and the customer discovers water ingress on opening. The value of vibration testing therefore lies not in checking for visible damage but in providing resonant frequencies, amplification factors and before-and-after functional comparison data.
Q: Should I choose sinusoidal or random vibration? A: Choose by purpose; the two serve different ends. A sinusoidal sweep concentrates energy and is highly interpretable, with a one-to-one correspondence between frequency and response, which makes it the best tool for a resonance search, that is, for finding natural frequencies and amplification factors. Random vibration is closer to the real transport environment, because road excitation is inherently broadband and random, which makes it the best tool for transport endurance and fatigue assessment. The most efficient combination in practice is a two-step approach: run a low-level sinusoidal sweep to identify resonant points and obtain the frequency response curve, then use that to confirm whether the random profile covers those bands and whether the energy at resonance is sufficient. If a specific failure must be reproduced or localised, add a targeted fixed-frequency dwell at the resonant frequency. Where the customer standard specifies a method, follow the customer standard.
Q: How do I read a PSD curve, and does equal RMS mean equal severity? A: The horizontal axis of a PSD is frequency and the vertical axis is power spectral density, reflecting vibration energy per unit band. The curve is usually made of several straight segments with defined breakpoints; a flat segment means uniform energy distribution and a sloped segment means energy varies with frequency. The overall root-mean-square acceleration equals the square root of the area under the curve and is the usual overall severity measure. Equal RMS values do not, however, imply equal severity. If one profile concentrates its energy in a narrow band and another spreads it across a wide band, both can give the same RMS while causing completely different failures. When the narrow band happens to sit on a structural resonance, the first profile is substantially more destructive. When assessing a profile, therefore, look beyond RMS at how the energy is distributed across frequency, and particularly at the density value at the resonant point.
Q: What is the resonance amplification factor, and how high is dangerous? A: The amplification factor is the ratio of response to input at the resonant frequency, and in theory it is approximately one divided by twice the damping ratio, so a damping ratio of 0.05 amplifies about ten times and a ratio of 0.01 about fifty times. Whether that is dangerous cannot be decided from the amplification alone. Three things must be combined: which band the resonance occupies, how much energy real transport carries in that band, and whether the amplified stress exceeds the capacity of the structure or connections. A resonance amplifying three times but sitting on a transport energy peak can be more dangerous than one amplifying fifteen times but far from the energy concentration. A report should therefore give both the resonant frequency and the amplification factor, and relate them to the target profile.
Q: What is Miner's rule in fatigue analysis and how is it used? A: Miner's linear damage accumulation rule is an engineering method for breaking a complex load into manageable segments. The load is divided by level, the ratio of actual cycles to cycles-to-failure at that level is computed for each segment, and all the ratios are summed to give the cumulative damage D. Failure is theoretically reached when D equals one. The key input is the material S-N curve, which relates stress amplitude to cycles to failure. For polymers one point needs care: the S-N curve often has no distinct horizontal portion, meaning there is no absolutely safe stress level, only slower damage accumulation. In random vibration, damage scales with a high power of stress amplitude and stress amplitude is amplified at resonance, so damage is contributed mainly by energy near the resonant peak and optimisation should target the resonant band first.
Q: Why does the case survive while its contents fail? A: This is usually coupled resonance. The contents are connected to the case through the liner, forming a two-degree-of-freedom coupled system. When the natural frequency of the contents approaches a case mode, the two couple and amplify together, producing the most dangerous condition. The measured case surface response may be modest, while the acceleration actually experienced by the contents is large. To find this, accelerometers must be placed on the contents or on a simulated payload during the resonance search; monitoring the case alone will miss it. The usual remedy is to adjust the effective stiffness of the liner so the natural frequency of the contents-and-liner system moves away from the main transport energy band, rather than simply thickening the case.
Q: Is a softer liner always better? A: No, and this is a common misconception. The reason lies in the frequency ratio principle of vibration isolation: transmissibility depends on the ratio of excitation frequency to system natural frequency, and when that ratio is below about 1.414 the isolation system amplifies vibration rather than reducing it. If the liner is chosen too soft, the natural frequency of the contents-and-liner system drops, and once it falls inside the band where transport vibration energy concentrates, the vibration is amplified. Cushioning and isolation are also different objectives: cushioning addresses short-duration shock and seeks energy absorption, while isolation addresses sustained vibration and seeks lower transmissibility, and the material requirements are not identical. The usual engineering compromise places the frequency ratio between about 2.5 and 5, obtaining meaningful isolation while maintaining static stability and avoiding excessive displacement.
Q: How does test duration correspond to real transport time? A: The two are related through the compression relationship defined in the applicable standard, not one to one. The reason is that the laboratory cannot and need not reproduce weeks of sea freight or tens of hours of road transport in full; instead the level is raised to shorten the time so that the cumulative damage is equivalent. The compression ratio must follow the standard, and the basis must be stated in the report rather than estimated independently. Two further points matter: the compression must not introduce failure mechanisms absent from real transport, for example raising the level to the point of local plastic deformation; and the duration must be distributed across the three axes rather than concentrated in one. Where the customer or the standard provides an explicit profile and duration, adopt it directly without independent compression.
Q: Which items should be rechecked after a vibration test? A: Five categories are recommended as a minimum. First, appearance and structure, checking for cracks, whitening, deformation and loose fasteners, with particular attention to rib roots, insert surroundings and wall thickness transitions. Second, latch clamp force, measured before and after with a force gauge to quantify the loss. Third, sealing performance, the item most often overlooked and among the most important; run an airtightness test and supplement with immersion where necessary, because gasket compression set often only appears after the test. Fourth, contents position, quantified through position marks made before the test. Fifth, any required functional checks such as opening force, hinge rotational resistance and handle load capacity. Only with before-and-after data does a report carry engineering value; otherwise it merely shows that nothing visibly broke on that occasion.
Conclusion and Related Reading
Back to the question in the title: what is vibration testing for in a protective case? It turns invisible transport damage into measurable laboratory data. A sinusoidal sweep finds the resonant frequencies and amplification factors. Random vibration described by a PSD applies a realistic broadband excitation. S-N curves and Miner's rule assess the fatigue margin. The destructive power of transport vibration comes mainly from resonance amplification, so the focus of the test is not how long it runs but which frequency amplifies, by how much, and how much energy real transport carries there.
Three actions you can take immediately. First, make the resonance search a routine part of validation, and require the report to give resonant frequencies, amplification factors and their relationship to the target profile rather than a bare pass verdict. Second, make an airtightness check a fixed recheck item on the vibration test, specifically to catch the hidden failure path in which the case looks intact but no longer seals. Third, improve in the order of damping and frequency shifting first, isolation second, structural strengthening last, which typically achieves better results at lower weight and cost.
JUNZHJIA, manufactured by KeXin New Materials (Guangdong) Co., Ltd., produces protective cases, tool boxes, military-spec storage cases and waterproof junction boxes for wholesale, distribution, OEM and ODM programmes and global supply. The company can configure vibration test plans, resonance searches and fatigue assessments around a customer's logistics route and payload characteristics, and supplies structural documentation, custom liner design and test files alongside the product.
Related Reading