

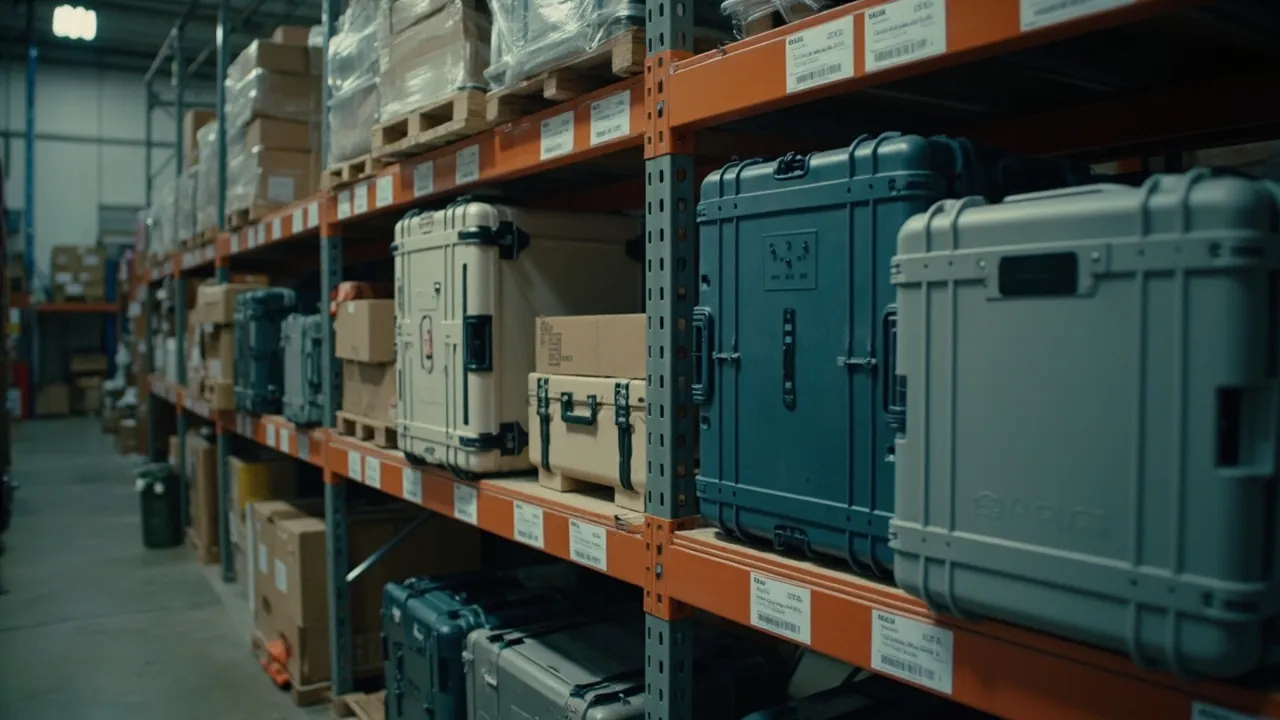
Short answer: safety stock is not "ordering a bit extra". It is a buffer calculated from a formula - safety stock equals the service level factor multiplied by the combined standard deviation of demand and lead time variability - and the reorder point equals average consumption during lead time plus safety stock. That is the whole method. What decides whether the result is good is not the formula but three inputs: average daily consumption, the true length of the lead time, and the variability of both. Most companies get safety stock wrong not because the maths is hard, but because they treat the lead time a supplier promised as the actual lead time, and last month's shipments as the average daily demand. The buffer they calculate is then neither safe nor economical.
This article is written for B2B procurement, warehouse and supply chain planning staff. It breaks the problem into five executable steps: understand what safety stock is actually protecting against, apply the core formula and choose a service level, quantify lead time and demand variability, build a stocking matrix for common specifications and resolve the conflict with minimum order quantity, and close the loop with holding cost, obsolescence and performance review. All coefficients, ratios and formula outputs are typical or empirical values used to build a calculation framework. Formal parameters should be set from the company's own shipment history, the supplier's actual lead time distribution and the finance department's cost definitions. If you manage stock for protective cases, toolboxes, military specification storage boxes or waterproof junction boxes, and you are caught between being chased for stockouts and criticised for excess inventory, this method can be applied directly.
Contents
- Short answer: safety stock is calculated, not guessed
- What safety stock actually protects against: four types of uncertainty
- The core formula: safety stock and reorder point
- Choosing a service level: the trade-off from 90 to 99.9 percent
- Breaking down lead time: seven stages, none of which can be omitted
- Quantifying demand variability: standard deviation, coefficient of variation and forecast error
- Which specifications to stock: ABC-XYZ classification
- Stocking matrix for common specifications: size, colour, insert and seal combinations
- Resolving the conflict between MOQ and safety stock
- Seasonality, peak season and project demand
- Holding cost and obsolescence: the invisible money
- Inventory performance indicators and review routine
- Frequently Asked Questions
- Conclusion and Related Reading
Short answer: safety stock is calculated, not guessed
Start with the concept. Safety stock is the extra buffer held to cover demand above expectation or lead time longer than expectation. It does not serve normal consumption; it serves uncertainty only. Its size should therefore be determined by two things: the magnitude of the uncertainty and the stockout risk you are willing to accept.
The reorder point is a separate concept that is often confused with it. It answers "at what level should I place the next order", and therefore equals average consumption during lead time plus safety stock:
Reorder point = average daily consumption x lead time + safety stock
Many people treat the reorder point as the safety stock, producing two typical errors. One is setting the order point equal to safety stock, so every order is placed too late and stockouts recur. The other is adding the two together and double counting, which inflates inventory.
One easily overlooked precondition: safety stock only makes sense for items that can be replenished. If a model has been discontinued, or the supplier requires a single buyout with no further supply, what is needed is not safety stock but a one-time purchase quantity decision, which is a different problem.
One line to memorise: safety stock protects against uncertainty, not against insufficient quantity.
What safety stock actually protects against: four types of uncertainty
Classify the uncertainty and it becomes clear which formula to use and where to get the data.
| Uncertainty type | Source | Impact | Data source |
|---|---|---|---|
| --- | --- | --- | --- |
| Demand variability | Customer orders fluctuating, projects starting together | Consumption exceeds expectation | Shipment history, customer forecast |
| Lead time variability | Scheduling queue, capacity contention, late raw material | Replenishment later than expected | Actual arrival records |
| Lead time length | Production cycle, inspection, transport, clearance | Longer window to cover | Purchase ledger, logistics records |
| Supply quality | Incoming batches rejected and returned | Effective supply reduced | Incoming inspection records |
Demand variability is the most discussed but often not the main cause. For standard protective case specifications demand is usually fairly stable. Real volatility comes from project orders: one large project taking several hundred units concentrates a month of consumption into a few days.
Lead time variability is the most overlooked and often the most influential. Many companies calculate using only "the lead time the supplier quoted", while actual arrivals vary considerably. If a supplier's lead time is randomly distributed between 30 and 60 days, setting safety stock for 30 days guarantees frequent stockouts. The right approach is to calculate the standard deviation of lead time from historical arrival data.
Lead time length sets the absolute scale of the buffer. If lead time doubles from 30 to 60 days, safety stock does not double; it rises by about 41 percent, because safety stock is proportional to the square root of lead time. If lead time variability also rises, the increase is larger still.
Supply quality is often ignored entirely. If a supplier's incoming batches have a meaningful reject rate requiring return or sorting, available stock is lower than the ledger suggests. In that case safety stock needs an additional quality buffer. For the judgement method at goods-in, see how to sample protective cases at incoming inspection. Feeding inspection data back into safety stock parameters is a step many companies skip and one with clear returns.
The core formula: safety stock and reorder point

Two cases. In practice the overwhelming majority belong to the second.
Case one: stable lead time, demand variability only.
Safety stock = Z x sigma_d x square root of LT
where Z is the service level factor, sigma_d is the standard deviation of demand per period (usually per day), and LT is the lead time expressed in the same unit.
Case two: both demand and lead time vary (recommended).
Safety stock = Z x square root of ( LT x sigma_d squared + d_bar squared x sigma_LT squared )
where d_bar is average daily demand and sigma_LT is the standard deviation of lead time. The essence of this formula is to add the variances from two independent sources and then take the square root, producing a combined standard deviation.
Reorder point:
Reorder point = d_bar x LT + safety stock
A worked example. Suppose a protective case model consumes on average 20 units a day with a demand standard deviation of 6 units, the average lead time is 30 days with a lead time standard deviation of 5 days, and the target service level is 95 percent, giving Z of 1.65:
- Demand term: LT x sigma_d squared = 30 x 36 = 1080
- Lead time term: d_bar squared x sigma_LT squared = 400 x 25 = 10000
- Combined: square root of (1080 + 10000) = square root of 11080 = about 105.3
- Safety stock = 1.65 x 105.3 = about 174 units
- Reorder point = 20 x 30 + 174 = 774 units
The most valuable observation from this example is that the lead time term dominates the demand term by a wide margin. If the lead time standard deviation falls from 5 days to 2 days, safety stock drops from about 174 to about 106 units, a fall of nearly 40 percent. This means that for standard items such as protective cases, stabilising lead time reduces inventory far more than improving demand forecasting does. It is a counter-intuitive but important conclusion, and it explains why many companies invest heavily in forecasting with little result.
| Parameter | Meaning | Source | Common error |
|---|---|---|---|
| --- | --- | --- | --- |
| d_bar | Average daily demand | Daily average from 6-12 months of shipments | Substituting "last month" or "the peak month" |
| sigma_d | Demand standard deviation | Historical variation per day or per week | Using a monthly figure as a weekly one |
| LT | Average lead time | Average from actual arrival records | Using the supplier's promised lead time |
| sigma_LT | Lead time standard deviation | Variation in actual arrivals | Ignoring this parameter entirely |
| Z | Service level factor | Looked up from the target service level | Always using 1.65 or 2 |
Four calculation disciplines:
- Time units must be consistent. If demand is measured weekly, the lead time must also be in weeks. Mixing days and weeks is the most common elementary error.
- Do not use too short a history window. Six to twelve months usually covers seasonality; using one to three months treats an occasional spike as normal.
- Be careful about removing outliers. A one-off large project order inflates the standard deviation noticeably. The correct approach is to track it separately rather than simply delete it.
- Update parameters regularly. Recalculate quarterly or half-yearly. Do not set and forget.
Choosing a service level: the trade-off from 90 to 99.9 percent
The Z value is a trade-off between stockout cost and inventory cost. The higher the service level, the larger the safety stock, and the relationship is non-linear: moving from 95 to 99 percent raises safety stock by roughly 40 percent, and moving from 99 to 99.9 percent adds about another 30 percent.
| Target service level | Z value (approximate) | Relative safety stock | Suitable for |
|---|---|---|---|
| --- | --- | --- | --- |
| 90 percent | 1.28 | 1.00, the baseline | Interchangeable general specifications with low stockout impact |
| 95 percent | 1.65 | 1.29 | Standard industrial customers, negotiable dates |
| 97.5 percent | 1.96 | 1.53 | Important customers, visible dissatisfaction if short |
| 99 percent | 2.33 | 1.82 | Critical equipment support, high line-stop risk |
| 99.5 percent | 2.58 | 2.02 | Customer contracts with delivery penalties |
| 99.9 percent | 3.09 | 2.41 | Strategic items that must never be short |
Three practical principles for setting service levels:
First, tier by specification, do not apply one level to everything. Fast-moving general specifications can sit at 97 to 99 percent, while long-tail specifications can sit at 90 to 95 percent or not be stocked at all. Setting everything at 99 percent ties up cash in the long tail, which is the most common and most expensive mistake.
Second, look at the real cost of a stockout. If a stockout only means a customer receives goods two weeks later, the cost is limited. If it stops a production line or triggers a contractual penalty, the cost is very high. Service levels should be confirmed jointly by the business side and the customer, not decided unilaterally by the warehouse.
Third, define service level consistently. The two common definitions are cycle service level, the probability of not stocking out within a replenishment cycle, and fill rate, the proportion of orders fully satisfied. They give different numbers and mean different things, so the definition must be stated before cross-departmental discussion.
A rule of thumb: if your inventory turnover is low for your industry but stockouts are still frequent, the problem is almost certainly wrong parameters - lead time set too short, demand set too high, or a badly shaped specification portfolio - rather than a service level set too low.
Breaking down lead time: seven stages, none of which can be omitted
The accuracy of the lead time figure determines the effectiveness of the safety stock. The correct lead time runs from the moment stock hits the reorder point to the moment replenishment is usable, not the supplier's stated production cycle.
| Stage | Typical duration (empirical) | Source of variability | How to compress |
|---|---|---|---|
| --- | --- | --- | --- |
| Requirement confirmation and ordering | 1-3 days | Approval, price confirmation | Approval-free limit, ordering under a framework agreement |
| Supplier scheduling queue | 3-15 days | Capacity contention, order queue | Reserved capacity, locked monthly schedule |
| Manufacturing | 7-25 days | Mould condition, raw material arrival, yield | Stable scheduling, higher yield |
| Factory inspection | 1-3 days | Inspection plan, handling of rejects | Run in parallel with production, clear sampling plan |
| Packaging and preparation | 1-3 days | Packaging material arrival | Keep packaging materials in stock |
| Inland transport | 2-7 days | Carrier, weather | Fixed carriers, mixed transport modes |
| Incoming inspection and receipt | 1-2 days | Inspection verdict, put-away | Simplify the flow, prepare bin locations in advance |
| Additional for imports: sea freight and clearance | 20-45 days | Sailing schedule, inspection, port delay | Book early, pre-review documents |
Four practical points:
First, use actual data, not promised values. Record the order date and the usable date of every arrival in the purchase ledger. After 10 to 20 orders, a reliable mean and standard deviation can be calculated. This action costs very little and delivers the largest single improvement in safety stock accuracy.
Second, separate normal lead time from abnormal lead time. Lead times during peak season, around the Lunar New Year and during power restrictions are usually significantly longer. The right treatment is to set a separate safety stock parameter for the peak period, not to pull the annual average up to the peak level.
Third, compress external stages first. The scheduling queue and transport are the two most variable stages and the two most improvable through negotiation. Agreeing reserved capacity and a fixed window with the supplier is often worth more than simply pushing the price down.
Fourth, model imports separately. For imported protective cases the lead time includes sea freight, clearance and inland transport, with far greater variability than domestic purchasing, plus the risk of a sudden extension for inspection. For import programmes the full process distribution must be used in the calculation. For detail on export and logistics stages, see cross-border logistics for protective cases: export packaging and customs documents; the route analysis there applies equally to imports.
Quantifying demand variability: standard deviation, coefficient of variation and forecast error

Demand variability is the second input in the formula and the easiest to get wrong. Three quantification methods suit different situations.
Method one: historical standard deviation. Take 6 to 12 months of actual shipments on a consistent period (daily or weekly) and calculate the standard deviation. This is the most direct method and suits specifications with relatively stable demand.
Method two: coefficient of variation. CV equals the standard deviation divided by the mean. It is dimensionless and allows comparison of volatility across specifications. Empirically, a CV below 0.3 is relatively stable, 0.3 to 0.6 is moderately volatile, and above 0.6 is highly volatile. Highly volatile specifications should either carry a higher service level or be moved to a purchase-on-order model.
Method three: standard deviation of forecast error. Where a formal forecasting process exists, what needs buffering is not demand itself but forecast error. Substituting the standard deviation of forecast error for the standard deviation of demand usually reduces safety stock materially, because the forecast already explains part of the variation. This is where accurate forecasting genuinely pays, provided the forecast error is actually quantified rather than described as "the forecast is okay".
| Method | Data requirement | Suitable for | Limitation |
|---|---|---|---|
| --- | --- | --- | --- |
| Historical standard deviation | 6-12 months of shipments | Standard stable specifications | Does not capture trend changes |
| Coefficient of variation | Same | Comparing across specifications | Distorted when the mean is very small |
| Standard deviation of forecast error | Historical forecast versus actual | Companies with a formal forecasting process | Depends on forecast quality and record completeness |
Three traps:
First, treating seasonality as random variation. If a specification clearly sells more before the rainy season, its variation is predictable. For seasonal specifications the correct move is to build stock ahead of the peak, not to rely on safety stock to absorb it.
Second, mixing data granularity. Using a monthly standard deviation in a daily calculation inflates safety stock several times over. Convert granularity by the square root of the time ratio, not linearly.
Third, ignoring zero-consumption periods. If a specification consumes nothing in most periods and ships in a burst in a few, the standard deviation is distorted. Such specifications suit an event-driven stocking logic rather than a continuous safety stock formula.
Which specifications to stock: ABC-XYZ classification
Not every specification deserves physical stock. ABC-XYZ is a two-dimensional classification: A, B and C by value or consumption value, and X, Y and Z by demand stability. The combinations call for completely different inventory strategies.
| Quadrant | Characteristics | Inventory strategy | Suggested service level |
|---|---|---|---|
| --- | --- | --- | --- |
| AX | High value, stable demand | Fine management, regular replenishment, consignment or VMI possible | 97-99 percent |
| AY | High value, volatile demand | Small, frequent replenishment, locked capacity | 95-97 percent |
| AZ | High value, sharply volatile demand | Purchase to order wherever possible, avoid holding | 90-95 percent |
| BX | Medium value, stable demand | Standard safety stock model | 95-97 percent |
| BY | Medium value, volatile demand | Moderate stock plus fast replenishment capability | 93-95 percent |
| BZ | Medium value, sharply volatile | Little or no stock, move to purchase on order | 90-93 percent |
| CX | Low value, stable demand | Buy in larger lots to reduce order frequency | Above 95 percent |
| CY | Low value, volatile demand | Decide by minimum order quantity | 90-95 percent |
| CZ | Low value, sharply volatile | No physical stock, purchase on order | - |
The most important use of this table is reverse validation. If a company finds it is holding heavy stock in CZ quadrant specifications, the cause is almost certainly a missing classification exercise: low-value, high-volatility items should not be absorbing cash.
Protective case specifications have one particularity worth noting: models often substitute for each other. A case one size larger can serve as an imperfect substitute for a smaller one, but not the reverse. So service levels should be set by specification family rather than by individual specification, which reduces the number of stocked variants without lowering customer satisfaction.
Another particularity is that accessories are tied to complete cases. Seals, latches and handles follow different stocking logic from complete units: they are cheap, small, and short supply directly hits after-sales. For replacement cycles and stocking of wearing parts, see how to set a silicone gasket replacement cycle. Accessory stock is best set as a proportion of complete case stock rather than modelled independently.
Stocking matrix for common specifications: size, colour, insert and seal combinations
Now to concrete specifications. Stocking decisions for protective cases are essentially a choice about which combinations of size, colour, insert and seal to hold physically, within that combination space. The more combinations, the more scattered the inventory and the slower the turnover.
Step one: establish main size classes. Compress the product line into three to five size classes, for example small, medium, large and extra large, each with one lead model. Size is the parameter customers are most sensitive to and the hardest to substitute, so all size classes should be stocked.
Step two: stock the main colour and make others to order. Black is usually the general-purpose main colour and should be stocked across all sizes. Other colours are made to order or carry a higher minimum quantity. Empirically, every additional colour visibly fragments inventory within a size class while improving customer satisfaction only marginally.
Step three: split inserts into standard and custom. Stock a standard configuration, such as plain foam sheet or a general pre-scored cavity, and make custom inserts to order. Inserts are the most customised and most obsolescence-prone element, and should not be pre-built against uncertain demand.
Step four: stock seals and wearing parts separately. Set a minimum spare stock by model for seals, latches and handles, because they serve both new case sales and after-sales replacement.
| Stocking dimension | Suggested strategy | Share of inventory (empirical) | Main risk |
|---|---|---|---|
| --- | --- | --- | --- |
| Size | Stock three to five classes fully | 60-70 percent | Too many size classes fragments stock |
| Colour | Stock the main colour, make others to order | 10-15 percent | Too many colours creates obsolescence |
| Insert | Stock standard, make custom to order | 10-15 percent | Custom inserts cannot be resold |
| Seals and wearing parts | Minimum spare quantity by model | 5-10 percent | Too little stock harms after-sales |
A practical convergence method: rank the past twelve months of shipments by size and colour combination, take the leading combinations covering about 80 percent cumulatively as stocked variants, and move the rest to make-to-order. This typically reduces stocked SKUs by 30 to 50 percent with no material effect on the in-stock fill rate.
Resolving the conflict between MOQ and safety stock

This is the most real tension in protective case stocking: the quantity produced by the safety stock formula is often far below the supplier's minimum order quantity, while ordering at MOQ pushes inventory up. For the reasons behind the MOQ threshold, see custom protective case MOQ baseline.
There are five resolutions, listed in recommended order.
| Resolution | How it works | Conditions | Cost |
|---|---|---|---|
| --- | --- | --- | --- |
| Raise order frequency, order at the MOQ floor | Order at MOQ but shorten the interval | MOQ not too high, demand stable | More orders, higher processing cost |
| Consolidate specifications in one order | Several specifications together meet MOQ | Same material and colour family | Supplier must accept mixed lots |
| Lengthen the replenishment cycle | Move from monthly to quarterly ordering | Adequate cash, good storage conditions | Higher average inventory and tied-up cash |
| Negotiate a lower MOQ | Trade price or a long-term commitment for MOQ | Existing long-term relationship | Unit price may rise |
| Move to purchase on order | No physical stock, buy when orders arrive | Acceptable lead time, customer permits | Longer lead time, loss of the in-stock advantage |
The recommended combination is consolidated ordering plus higher order frequency. In practice: move the ordering cycle from monthly to fortnightly, and consolidate several specifications of the same material and colour into one order to meet the MOQ. This satisfies the supplier's minimum while keeping average inventory at a reasonable level.
An often overlooked constraint is storage conditions. Lengthening the replenishment cycle means more inventory, and protective cases have storage requirements covering temperature, humidity, light and stacking, while seals also have a material shelf life. For the specific storage requirements and stacking rules, see warehouse and storage rules for protective cases. If the warehouse cannot support long-term storage, the real cost of holding more stock is higher than the ledger suggests.
A rule of thumb: when MOQ conflicts with safety stock, change the ordering rhythm first, not the safety stock. Safety stock is determined by uncertainty and should not be adjusted to accommodate an MOQ.
Seasonality, peak season and project demand
The standard safety stock formula assumes demand is a stationary random process. In practice protective case demand carries clear seasonal and project patterns and needs extra handling.
Handling seasonal demand in three steps:
- Identify the seasonal pattern. Arrange the past two to three years of shipments by week or month and look for stable peaks and troughs. Common seasonal drivers include outdoor projects starting before the rainy season, year-end project acceptance, and industry-specific shutdown and overhaul cycles.
- Build stock ahead of the peak rather than raising safety stock. Seasonal demand is predictable, so the correct response is to have the goods ready before the peak - a one-off action at a defined point in time - rather than carrying a permanently higher safety stock. Give predictable demand to advance build; give unpredictable variation to safety stock. Do not mix the two.
- Set an exit mechanism. Clear surplus stock deliberately after the peak so that seasonal inventory does not become dead stock. Peak build must come with a fallback plan.
Handling project demand in three steps:
- Track it separately, outside the normal forecast. Large project orders should be tracked individually and not merged into routine demand statistics, since doing so inflates the standard deviation of standard specifications and needlessly enlarges safety stock.
- Work back from project milestones. The key to project demand is not inventory but delivery commitment. Establish the project milestones and the procurement lead time, then schedule the order date backwards from them.
- Assess the disposal of leftovers. Specifications remaining after a project may have no further demand. Evaluate disposal routes at the project approval stage, including resale, reconfiguration or stripping for accessories.
| Demand type | Characteristics | Response | Key indicator |
|---|---|---|---|
| --- | --- | --- | --- |
| Stable routine | Low variation, no clear trend | Standard safety stock model | In-stock fill rate, turnover |
| Seasonal | Identifiable peaks and troughs | Build stock ahead of peak | Peak fill rate, end-of-season surplus |
| Project | Large single quantity, clear timing | Work back from project, track separately | Project delivery achievement |
| Long tail and sporadic | Low frequency, small quantity | Purchase on order or pair with higher safety stock | Dead stock ratio |
Holding cost and obsolescence: the invisible money
Safety stock cannot be set by looking only at stockout risk; holding cost matters too. Inventory holding cost is usually expressed as an annual percentage of inventory value, with an empirical range of 15 to 25 percent, made up as follows.
| Cost element | Content | Empirical share |
|---|---|---|
| --- | --- | --- |
| Cost of capital | Interest or opportunity cost of tied-up funds | 5-10 percent |
| Storage cost | Rent, racking, energy, labour | 4-8 percent |
| Insurance and tax | Property insurance, possible taxes | 1-2 percent |
| Loss and depreciation | Damage, ageing, technical obsolescence | 3-6 percent |
| Administration | Counting, systems, handling | 2-4 percent |
An average inventory of one million currency units at a 20 percent holding rate costs two hundred thousand a year in hidden expense. This figure is usually far larger than anything procurement can save on unit price negotiation, which makes reducing safety stock a high-value cost reduction in itself, even though it never appears on a price list.
Three obsolescence risks specific to protective cases:
The first is colour obsolescence. Once a special colour stops selling, it is almost impossible to resell to other customers and can only be discounted or consumed internally.
The second is insert obsolescence. A custom insert is cut to the shape of a particular device; if that device is discontinued or redesigned, the inserts are worthless. This is the fastest-depreciating inventory category of all.
The third is expiry of seals and wearing parts. Rubber seals have a storage life, and long storage hardens them so that they may not meet performance requirements even unused. For the ageing mechanism, see how to judge protective case gasket ageing. Seal stock must follow first-in-first-out with shelf life control.
Four controls against obsolescence:
- Set a maximum stock level. Safety stock controls the floor, maximum stock controls the ceiling; the two together prevent unbounded growth.
- Build a dead stock identification routine. Automatically flag items with no shipment beyond a set number of days, issue a list regularly and assign an owner.
- Consume internally first. Special colours and inserts can go to internal use, samples, promotions or modification projects.
- Budget for write-off. Accept that a certain proportion of obsolescence is normal, set an annual write-off allowance and review the causes regularly. That is more realistic than chasing zero obsolescence.
Inventory performance indicators and review routine
Nothing improves without measurement. Five indicators are worth tracking for protective case inventory.
| Indicator | Definition | Reference target (empirical) | Main use |
|---|---|---|---|
| --- | --- | --- | --- |
| In-stock fill rate | Share of demand satisfied from stock | Above 95 percent | Whether safety stock is effective |
| Inventory turnover | Annual issues value divided by average inventory value | Industry and category dependent | Capital efficiency |
| Days of supply | Average inventory divided by average daily consumption | Matched to lead time | Inventory depth |
| Dead stock ratio | Share of inventory with no shipments beyond a set period | Kept low | Inventory health |
| Forecast accuracy | Agreement between forecast and actual | Improving steadily | Sets the floor for safety stock |
Review quarterly, focused on three questions:
First, do the safety stock parameters need updating? Check whether average daily demand, mean lead time and lead time standard deviation have moved materially. A change of supplier, a production line adjustment or a change of transport mode all invalidate historical parameters.
Second, what caused each stockout? Classify each event as demand above expectation, extended lead time, quality return, forecast error or operational error. If stockouts come mainly from extended lead time, the solution lies with the supplier; if from demand above expectation, it lies with forecasting and safety stock. Misattribution sends improvement in the wrong direction entirely.
Third, what caused the dead stock? A cancelled project, a colour misjudgement, or excessive custom inserts? Different causes call for completely different actions.
For the overall service life and disposal logic of protective cases, see how many years a protective case lasts and whether retired protective cases can be recycled and reused. Long storage also consumes a product's useful life, which should be considered when setting maximum stock levels.
Frequently Asked Questions
Q: Who should decide the service level that feeds the safety stock formula?
A: The business side should decide, with procurement and warehouse providing data, and management confirming at the end. The reason is that the service level is fundamentally a commercial decision: it determines how much stockout is acceptable, and only the business side, close to the customer and aware of the consequences, can judge that. The role of procurement and warehouse is to supply three kinds of data - the demand distribution by specification, the mean and variability of actual lead time, and the safety stock amount and holding cost associated with each service level - so the decision maker can weigh stockout risk against tied-up capital with evidence. The common organisational error is letting the warehouse set the service level alone, which usually pushes it too high because the warehouse wants never to be short, tying up large amounts of cash. The recommended approach is a tiered table: high service level for fast-moving standard specifications, lower service level or no stock at all for the long tail, adjusted quarterly against actual stockout events.
Q: We only have a few dozen orders of history. Is the standard deviation still reliable?
A: With a small sample the sample standard deviation is unstable, but it can still be calculated with a conservative correction. Three practical approaches. First, widen the statistical base: if the same specification ships across different customers or regions, pool the data to raise the sample size; if the specification's history is too short, use the variability of the same size family as a proxy. Second, estimate conservatively: with fewer than 20 observations, scale the calculated standard deviation up, perhaps by 20 to 30 percent, as a buffer, and revert to the theoretical value once more data accumulates. Third, blend in experience: for a brand new specification with no history, start from the coefficient of variation of a mature comparable specification and correct it monthly as shipments come in. The key point is that parameters are not calculated once, they are iterated continuously. Being conservative at the start and calibrating after two or three quarters is more practical than chasing precision from day one.
Q: We have many standard specifications. Would setting safety stock for all of them be too heavy?
A: That is exactly why ABC-XYZ classification exists. Safety stock of equal strength should not be applied to every specification. A three-step tiering works well. First, rank by shipment value and take the leading specifications covering roughly 80 percent cumulatively as class A. Second, split specifications into stable and volatile by variability. Third, set different service levels and replenishment rhythms for each combination. Class A stable specifications get fine management, regular replenishment and a high service level; class B gets moderate stock; class C and the long tail move to purchase on order or no stock. Empirically, after this tiering the SKUs needing fine management are usually only 20 to 30 percent of the total, and the rest can be managed more simply. Also exploit substitutability: if a case one size larger can substitute for a smaller one, set the service level by specification family rather than by individual specification, covering more demand with fewer stocked variants.
Q: When does the conclusion that lead time variability matters more than demand variability break down?
A: It reverses when demand variability itself is severe. A quick test is to compare the two variance contributions: the lead time term equals d_bar squared times sigma_LT squared, and the demand term equals LT times sigma_d squared. Where average daily demand is small and lead time variability is large, the lead time term dominates; where average daily demand is large and lead time is relatively stable, the demand term dominates. A concrete illustration: at average daily consumption of 5 units with a lead time standard deviation of 10 days, the lead time term contributes 2,500. At average daily consumption of 200 units with a demand standard deviation of 30 units and a 30-day lead time, the demand term contributes 27,000, making demand variability the main driver. So the right approach is not to choose between the two, but to calculate both terms, see which dominates, and direct improvement resources accordingly. This is precisely why the full formula beats the simplified one: it forces you to quantify both sources separately instead of assuming.
Q: Should we purchase on order or hold stock? How do we decide?
A: The decision rests on a combination of three variables: lead time, the waiting time the customer will accept, and the cost of a stockout. If lead time is shorter than the longest wait the customer accepts and stockouts are cheap, purchasing on order is the most economical route and inventory is zero. If lead time clearly exceeds the customer's tolerance, or a stockout causes project delay, a line stop or a penalty, physical stock is necessary. The middle ground is partial stocking: hold stock covering the highest-frequency demand for standard specifications and purchase the rest on order, using stock for short-lead, small-quantity orders and make-to-order for long-lead, large-quantity orders. Protective cases typically have reasonably controllable lead times for standard specifications and moderate customer sensitivity to timing, so the sensible choice for most companies is stock for standard specifications plus make-to-order for special ones. For custom specification thresholds, see custom protective case MOQ baseline; it determines which specifications are worth adding to the stocking list.
Q: Can protective cases that have been in storage a long time still be sold as new?
A: It depends on storage conditions and duration; it cannot be generalised. Plastic shells under normal temperature, humidity and light conditions usually show limited structural change over long storage. Three categories of component do degrade over time: seals harden and lose resilience; hardware can corrode; and labels and markings can lift or fade. The right approach is therefore that long-stored inventory should undergo a simple re-check before dispatch, focused on the appearance and feel of seals, whether latches open and close smoothly, whether hardware shows rust, and whether markings remain legible. If a seal has hardened or cracked, replace it before dispatch. For specific storage requirements covering temperature, humidity, light and stacking, see warehouse and storage rules for protective cases; for seal replacement criteria, see how to set a silicone gasket replacement cycle. Write a rule into the inventory policy requiring a re-check before dispatch for stock held beyond a defined period.
Q: How far ahead should stock be built before peak season?
A: The lead time should equal the average lead time plus a defined buffer, not a fixed number of days chosen by intuition. Three steps. First, fix the start of the peak: the week or month when demand clearly begins to rise. Second, use the actual mean lead time for that specification, including inspection and receipt, as the base, then add a buffer to cover the extension of lead times during the peak, since supplier capacity tightens and lead times run longer than normal - this must be considered separately. Third, work back to the order date and, after receipt, confirm that the stock level has reached the planned peak target. Empirically, for clearly seasonal categories the advance is usually 1.2 to 1.5 times the normal lead time, and a post-peak clearance action should be planned at the same time so that seasonal inventory does not become dead stock. The cash tied up in a peak build is short-term and defined, which is fundamentally different from carrying a permanently higher safety stock.
Q: How often should safety stock be recalculated?
A: Review parameters at least quarterly and recalculate fully every six months. The review covers four items: whether average daily demand has shown a trend change; whether the mean and standard deviation of lead time have changed; whether the target service level still matches business needs; and whether the specification structure has changed through additions, discontinuations or substitutions. Four situations require immediate recalculation rather than waiting for quarter end: a change of supplier or production plant; a change of transport mode, for example from sea to road; a major product structure change such as discontinuing a lead specification; and two or more consecutive stockout events. The recalculation frequency need not be high, but the trigger conditions must be explicit, otherwise parameters stay invalid long after the business has changed while management continues to look at a set of seemingly precise numbers. Put parameter changes into the change management process, recording the reason and the effective date so they can be traced later.
Conclusion and Related Reading
Back to the question in the title: how should protective case inventory be planned? Quantify the uncertainty with a formula first. Get four parameters right - average daily demand, demand standard deviation, lead time and lead time standard deviation - and apply safety stock equals Z multiplied by the square root of LT times sigma_d squared plus d_bar squared times sigma_LT squared, with the reorder point equal to average consumption during lead time plus safety stock. The formula is simple; the difficulty lies entirely in the parameters. And the most valuable empirical finding among them is that for standard items such as protective cases, stabilising lead time reduces inventory more than improving demand forecasting does.
Three actions you can take immediately. First, record the order date and the usable arrival date of every purchase in the ledger; after ten orders you can calculate a real lead time mean and standard deviation to replace the supplier's promised figure. Second, tier specifications using ABC-XYZ, set a high service level and fine management for fast-moving stable specifications and move the long tail to purchase on order, rather than applying one level to everything. Third, set both a safety stock floor and a maximum stock ceiling, and build a dead stock identification and quarterly review routine so that inventory neither runs short nor grows without limit.
JUNZHJIA, manufactured by KeXin New Materials (Guangdong) Co., Ltd., covers protective cases, toolboxes, military specification storage boxes and waterproof junction boxes, and serves wholesale, distribution, OEM/ODM and global supply. The company can provide regular stock and lead time data for common specifications, MOQ baselines and quantity price breaks, and continuous supply of gaskets, latches, handles and other wearing parts, so procurement teams can establish reliable lead time parameters and spare part stocking policies.
Related Reading